
Motor Testing Methods: What Each Test Actually Catches Before a Motor Fails

Quick Answer
Motor testing isn't one measurement; it's eight distinct methods that each catch a different failure mechanism: insulation resistance and PI (IEEE 43) find degrading insulation-to-ground, surge testing (IEEE 522) is the only method that catches turn-to-turn weakness, and MCSA or vibration analysis catch rotor bar cracks and bearing defects that a clean megger reading will miss entirely.
A motor that passes its annual insulation resistance test can still fail eight weeks later from a cracked rotor bar or a spalled bearing race. That's not a contradiction. It's a gap in the test plan. Motor testing is not one measurement you run once a year and check off a maintenance ticket. It's a set of distinct methods, each built to catch a different degradation mechanism, and none of them substitutes for the others. If your predictive maintenance program leans on a single test type, you're blind to whatever failure mode that test wasn't designed to catch.
This matters because electric motor testing covers three physically different things: the winding insulation system, the mechanical condition of the rotor, bearings, and coupling, and the electrical performance of the machine under load. A megger reading tells you almost nothing about a bearing. A vibration spectrum tells you almost nothing about insulation-to-ground resistance. A test program that actually predicts failure means knowing what each method physically measures, and what it structurally cannot see.
A test that passes tells you the machine is fine with respect to whatever that test measures. It tells you nothing about every other way a motor can fail.
Why No Single Test Catches Everything
Motor failures fall into a handful of distinct categories, and each leaves a different signature. Winding insulation degrades from moisture, contamination, and thermal aging, which shows up in insulation resistance. Turn-to-turn insulation weakens from voltage stress and stays invisible to a standard insulation resistance reading. Connections loosen and corrode, raising localized resistance and generating heat. Rotor bars crack at the end-ring joint from thermal cycling and starting stress. Bearings degrade from lubrication failure, misalignment, or shaft currents. None of these mechanisms produce the same symptom, so no single instrument catches all of them.
A predictive maintenance program built around electrical maintenance and reliability services treats these as separate risk categories, because they are.
Insulation Resistance and IEEE 43: The First Test Every Technician Runs
What the Test Actually Measures
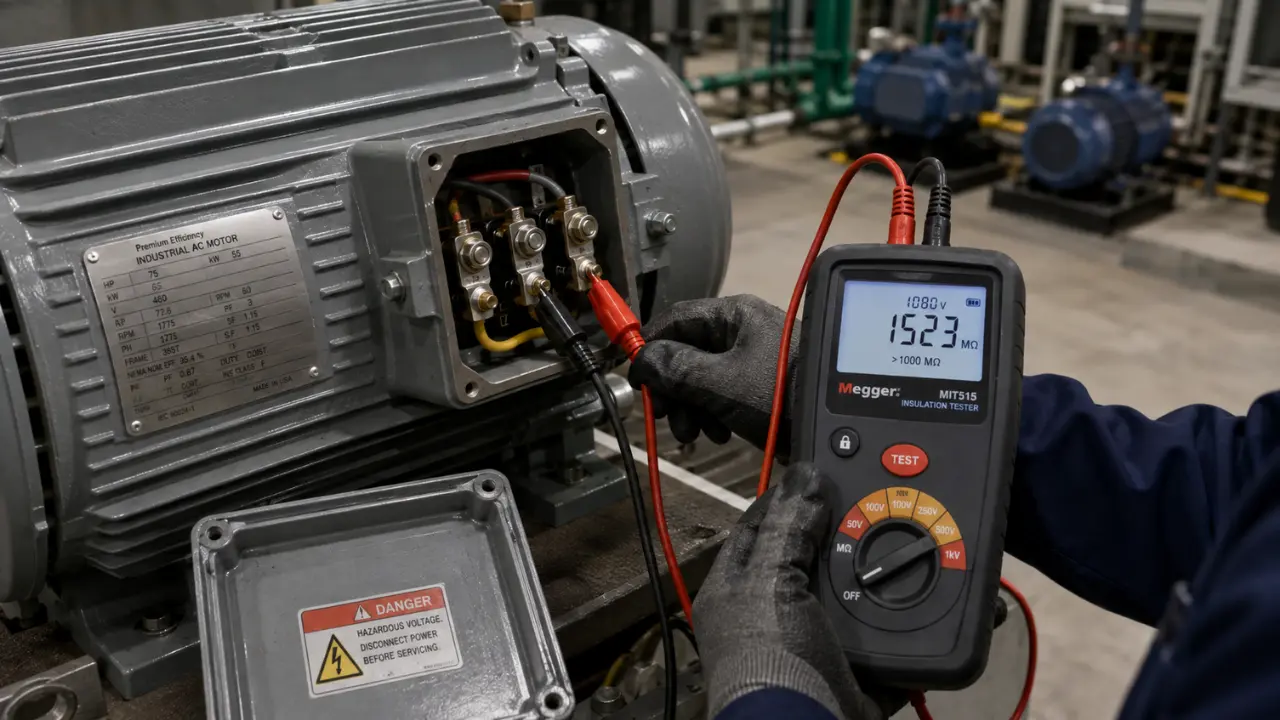
Insulation resistance testing applies a DC voltage, typically 500V DC for motors rated below 1 kV, between the winding and the frame, and measures the resistance of the leakage path through and across the insulation. Every predictive maintenance visit tends to start the same way: you megger test motor windings phase-to-ground before touching anything else, because a compromised insulation-to-ground path is the one failure mode that can hurt whoever runs the next test.
IEEE 43-2013, the Recommended Practice for Testing Insulation Resistance of Electric Machinery, governs how this test is run and interpreted for machines rated 750 W and above. The one-minute reading gets temperature-corrected to 40°C using correction curves specific to the insulation class, since insulation resistance drops as winding temperature rises. A motor insulation resistance test result of 5 MΩ on a cold winding and the same 5 MΩ on a winding running 30°C hotter mean very different things about the actual condition of the insulation.
The Polarization Index: Reading the Trend, Not Just the Number
The polarization index is the ratio of the 10-minute resistance reading to the 1-minute reading. Clean, dry insulation keeps absorbing charge over that window and the resistance climbs; contaminated or moisture-laden insulation plateaus almost immediately. IEEE 43-2013 Table 3 sets minimum recommended PI values by insulation thermal class, and for Class B and Class F insulation, which covers most industrial motors built since the 1970s, the minimum is 2.0.
There's a real limitation worth knowing. Modern vacuum-pressure-impregnated mica-epoxy windings often test so clean that the raw insulation resistance already sits in the multi-gigaohm range at one minute, where PI adds little information. IEEE 43 acknowledges this; on very high resistance windings, trending the absolute IR value over successive outages tells you more than the PI ratio alone. Either way, insulation resistance and PI say nothing about the condition between adjacent turns in the same phase, a separate failure mode covered further down. The insulation resistance, winding resistance, and dielectric testing methods run on transformers rely on the same physics, applied to a different winding geometry.
Winding Resistance Testing: Confirming Phase Balance
DC winding resistance testing uses a micro-ohmmeter or Kelvin bridge to measure resistance across each phase winding at a known, stable temperature. It catches a different set of problems than insulation resistance does: loose or corroded connections that raise resistance in one phase relative to the other two, and gross shorted turns that measurably lower resistance in the affected phase. Field practice generally flags an imbalance beyond roughly 2 to 5 percent between phases, since it drives unequal current draw and localized heating under load even on a motor that looks fine at standstill.
What winding resistance testing won't reliably catch is a handful of shorted turns buried in a winding with hundreds of turns per coil. The resistance change from two or three shorted turns is too small to separate from measurement noise and lead resistance, exactly why turn-to-turn faults need a test built specifically to find them.
Surge Testing: The Only Method That Catches Turn-to-Turn Weakness Early
IEEE 522-2023, the Guide for Testing Turn Insulation of Form-Wound Stator Coils for Alternating-Current Electric Machines, governs surge testing, sometimes called impulse testing. The test applies a fast-rising voltage pulse, on the order of nanoseconds to reach peak, to the winding. Because of how inductive and capacitive effects distribute a fast transient across a coil, that steep pulse concentrates most of its stress across the first few turns rather than spreading evenly through the winding. Comparing the resulting ringback waveform between phases, or against a stored reference, reveals a shift in ringdown pattern where turn insulation has thinned, well before it progresses to an actual short.
Insulation resistance and PI stress the insulation between the winding and ground. DC winding resistance confirms conductor continuity and gross imbalance. Neither applies enough voltage differential between two adjacent turns to reveal insulation weakening between turn N and turn N+1. Surge testing is the only method here that does: insulation resistance tells you the winding isn't leaking to ground today, while surge testing tells you whether it's about to short between two turns tomorrow. They are not measuring the same failure mode.
Fast-switching IGBT output stages on VFD-fed motors generate repetitive voltage spikes with steep dv/dt, concentrating additional stress on those same first few turns and adding weight to surge testing on drive-fed applications. IEEE 522-2023 governs the surge test procedure itself; VFD-specific dv/dt withstand limits sit in separate drive and motor guidance, but both concern the same turn-insulation vulnerability. Surge testing typically runs at commissioning, after any rewind, and periodically on machines important enough to justify the outage, which is part of the specification conversation in medium voltage motor selection and specification.
Static Motor Analysis: What PDMA Motor Testing Actually Covers
What field engineers commonly call PDMA motor testing is formally static motor circuit analysis, named for PdMA Corporation, whose analyzers popularized a full de-energized diagnostic in one session. A single test set measures resistance to ground, phase-to-phase winding resistance, inductance per phase, impedance, and capacitance to ground in one pass.
The distinguishing capability is the rotor influence check: the rotor is rotated through a full mechanical revolution in small increments while inductance is recorded at each position. Broken or cracking rotor bars and static air-gap eccentricity produce a characteristic variation pattern in that trace, all found with the motor de-energized. Because pdma motor testing happens offline, it's the natural companion to insulation resistance testing during a planned outage: same lockout, more diagnostic data per visit, catching a rotor-circuit problem the megger and winding resistance test were never designed to see.
Motor Current Signature Analysis: What MCSA Catches That Static Tests Cannot
Motor current signature analysis runs on an energized motor under real load. Current transducers clamp on the supply conductors, and the captured waveform runs through a fast Fourier transform to produce a current frequency spectrum. A broken or cracking rotor bar creates an asymmetry in the rotor circuit that generates a backward-rotating magnetic field, showing up as sideband frequencies around the fundamental at (1 ± 2s) times line frequency, where s is per-unit slip. That sideband pattern is the "signature" the method is named for.
Bearing degradation modulates the current spectrum too, at frequencies tied to the bearing's physical geometry: ball pass frequency outer race, ball pass frequency inner race, ball spin frequency, and fundamental train frequency. That signature is smaller in the current spectrum than in a direct vibration measurement, so MCSA works best as a corroborating bearing check rather than the primary method. It earns its place on motors you can't mount a vibration probe on: submersible or encapsulated motors, or machines inside a hazardous-area enclosure, since the signal rides back on the supply cable instead of a sensor at the bearing housing.
MCSA also catches something a static test can miss: some rotor bar cracks don't create enough asymmetry to register on a standstill rotor influence check, but show up once the motor is turning at operating speed and temperature, where thermal expansion affects how well a partially cracked bar still contacts the end ring.
Vibration Analysis: The Mechanical Signature
Vibration analysis on rotating machinery is governed by ISO 20816-3:2022, which sets evaluation zones A through D based on broadband vibration velocity in mm/s RMS, measured at the bearing housing, for machines above 15 kW. Zone A covers newly commissioned equipment, Zone B is acceptable for unrestricted operation, Zone C flags equipment unsuitable for continued running without remedial action, and Zone D means damage is imminent.
Vibration analysis catches bearing wear, rotor and coupling imbalance, shaft misalignment, mechanical looseness, and structural resonance. High-frequency envelope and spike energy analysis layered on the broadband reading picks up early-stage bearing defects well before they'd register as a severity change. Because vibration is a direct mechanical measurement at the bearing housing, it catches problems MCSA only infers indirectly; the reverse holds too, since MCSA picks up electrical rotor asymmetries an accelerometer cannot detect. On coupled multi-motor installations, including master/slave torque-controlled motor systems, a vibration signature on one machine can flag a coupling problem between paired drives rather than a bearing fault in isolation.
Thermal Imaging: Finding What Vibration and MCSA Don't See
The 2023 edition of NFPA 70B made infrared thermography a required inspection for energized electrical equipment rather than a recommendation, with a minimum annual interval and a six-month interval for equipment already flagged under its physical condition assessment. Thermal imaging catches loose or corroded power connections as a localized hot spot at a lug or splice, uneven heating across the three phases signaling winding imbalance or a developing turn fault, and blocked or degraded cooling airflow from a failed fan or a dust-clogged fin stack.
Thermal imaging is the only method here that directly measures a physical consequence, heat, rather than an electrical or vibration signature. A connection can run hot for months before it shows up as a change in insulation resistance, winding resistance, or vibration.
No-Load and Locked-Rotor Current Checks: The 3 Phase Motor Testing Basics
The no-load test runs the motor unloaded at rated voltage and frequency, isolating its fixed losses, core loss and friction and windage, from the current draw. IEEE 112 covers this as part of its formal no-load and locked-rotor procedures for laboratory efficiency determination, including the segregated-loss calculations in Method F for motors that can't run on a dynamometer; the field version skips that loss segregation and serves as a quick health read rather than a certified efficiency figure. A typical no-load current for a 4-pole motor runs roughly 30 to 50 percent of full-load amps, and a reading well outside that band, compared against baseline or a sister motor of the same frame, points to mechanical drag: a bearing preload problem, misaligned coupling, or fan installed backward.
The locked-rotor test holds the rotor stationary and applies reduced voltage, since motor impedance is essentially linear near standstill, then extrapolates the measured current to rated voltage and compares it against the nameplate locked-rotor kVA/hp code letter from NEMA MG-1's rating tables. Where three-phase variable voltage isn't available at the bench, IEEE 112's single-phase method applies full voltage to one phase at standstill and multiplies the result by 1.155 to estimate the three-phase figure. A reading well outside the code letter band points to rotor bar continuity or winding issues that only surface under the stress of an actual start, conditions a low-voltage static test doesn't reproduce.
A complete 3 phase motor testing checklist at commissioning always includes both current checks, because neither insulation resistance nor a static circuit analysis confirms how the motor performs once it's turning at rated speed under load. On larger frames without three-phase test power on hand, the single-phase method with the 1.155 correction avoids sourcing a heavier variable-voltage supply for a startup check. Locked-rotor current also shapes the starting-method decision covered in soft starters versus direct-on-line starting, since the inrush a motor pulls determines how much that decision matters for a given installation.
Test Method Comparison
| Test Method | What It Actually Catches | Energized / De-Energized | Typical Interval on Critical Motors |
|---|---|---|---|
| Insulation resistance + PI (IEEE 43) | Insulation-to-ground degradation: moisture, contamination, general aging | De-energized | Annually, and before re-energizing after any outage |
| DC winding resistance | Loose or corroded connections, phase imbalance, gross shorted turns | De-energized | Annually, at commissioning, after any rewind |
| Surge / impulse test (IEEE 522) | Turn-to-turn insulation weakness before it grounds out | De-energized | Commissioning, post-rewind, every few years on critical MV motors |
| Static motor analysis (PDMA-type) | Rotor bar issues and eccentricity at standstill, circuit imbalance, insulation trend | De-energized | Quarterly to annually, by criticality |
| Motor current signature analysis (MCSA) | Broken or cracking rotor bars and bearing defect frequencies under running load | Energized | Quarterly, or continuous online on critical assets |
| Vibration analysis (ISO 20816-3) | Bearing wear, imbalance, misalignment, looseness, resonance | Energized | Monthly, or continuous online |
| Thermal imaging | Loose connections, phase-imbalance heating, blocked cooling airflow | Energized | Annually minimum, 6 months for flagged equipment (NFPA 70B) |
| No-load / locked-rotor current | Mechanical drag, rotor bar continuity, starting performance vs. nameplate | Energized | Commissioning and after any rebuild |
Real-World Scenario: Passed Insulation Resistance, Failed Six Weeks Later
A fertilizer plant induced-draft fan motor, a 250 kW, 4-pole induction machine, came through its annual outage clean. Insulation resistance measured 800 MΩ, PI came in at 3.4, comfortably above IEEE 43's minimum of 2.0, and phase-to-phase winding resistance balanced within 1 percent. The outage budget covered a motor insulation resistance test and a visual inspection only, so no MCSA scan and no vibration route ran.
Six weeks later the fan started drawing intermittent current spikes and a low-frequency growl developed at the drive-end bearing. Within days the bearing failed outright. When the motor came apart, two adjacent rotor bars were found cracked at the end-ring joint, invisible from outside the machine and unrelated to the winding insulation system that had tested perfectly six weeks earlier.
That's a different failure population from what a megger or winding resistance test can see. A cracked rotor bar is a fault in the rotor conductor and end-ring joint, not the stator insulation, so it moves neither reading. A quarterly MCSA scan watching for sidebands around line frequency at the slip frequency would likely have shown the fault developing a cycle or two earlier, since the pulsating torque a broken bar produces is exactly the kind of cyclic load that accelerates bearing wear. A vibration route on that fan would have caught the same acceleration independent of the electrical root cause.
A clean megger test motor reading proves the insulation system passed. It says nothing about a bearing that's days from seizing.
Setting Test Frequency by Criticality
Not every motor on a site needs the same electric motor testing regimen at the same frequency, and pretending otherwise spreads a limited testing budget too thin to catch anything reliably. Test cadence should follow asset criticality: the consequence of an unplanned failure weighed against how hard that motor is to replace.
For a single-train motor with no installed spare, where a failure stops production and the replacement has real lead time, the full suite earns its keep: insulation resistance, PI, winding resistance, and static motor analysis at every outage; continuous or monthly MCSA and vibration monitoring in between; thermal imaging on whatever interval NFPA 70B calls for; surge testing at every rewind and periodically after that.
For important but spared equipment, an N+1 pump or fan where a failure is an inconvenience rather than a production stop, annual insulation resistance, winding resistance, and static motor analysis at each outage, paired with a quarterly MCSA and vibration route, is proportionate. For low-criticality motors backed by stocked spare motors and test instruments, an annual insulation check and a thermal pass cover the realistic risk, and the rest of the suite is reserved for failure investigations.
Motor value and replacement lead time belong in that criticality call as much as production impact does. A motor that's easy to swap from stock doesn't carry the same testing burden as one that takes months to source or rebuild. Building that matrix is core to what our reliability and electrical maintenance programs work through with plant teams.
Building a program like this isn't a one-afternoon exercise; it means ranking criticality honestly, not by habit, and matching each tier to the methods that cover its dominant failure modes. If you're building a motor testing program from scratch, or auditing one leaning too hard on a single method, reach out to our technical team and we'll walk through your motor list and build a test matrix around what your equipment actually needs.