
How a Battery Energy Storage System Works, and How to Design One That Holds Up

Quick Answer
A battery energy storage system works by moving DC energy from cells through modules, racks, a Battery Management System, a Power Conversion System, and an Energy Management System that coordinates charge and discharge; designing one that holds up means matching power (kW), energy (kWh), C-rate, chemistry, and thermal management to the actual load profile, not a generic spec sheet.
A battery energy storage system looks simple from the outside: a steel enclosure, some conduit, a chiller bolted to the side. What's happening inside is a stack of five subsystems that all have to agree with each other, in real time, or the installation underperforms or trips offline the first time it's asked to do real work. If you're evaluating a battery energy storage system for peak shaving, backup power, or renewable smoothing, the engineering decisions that matter happen well before anyone talks about brand names or price per kWh.
The question worth answering first is simple: how does a battery energy storage system work, end to end? This piece covers that, plus why lithium iron phosphate has become the default chemistry for stationary storage, how to size a system against a real load profile, and what current fire safety and interconnection requirements demand, closing with a worked sizing scenario, because sizing math is where most installations go wrong.
A battery energy storage system doesn't fail because the cells were bad. It fails because the power rating, energy rating, and duration were sized against an assumption instead of a load profile.
How Does a Battery Energy Storage System Work, End to End?
From Cells to Racks: The Physical Stack
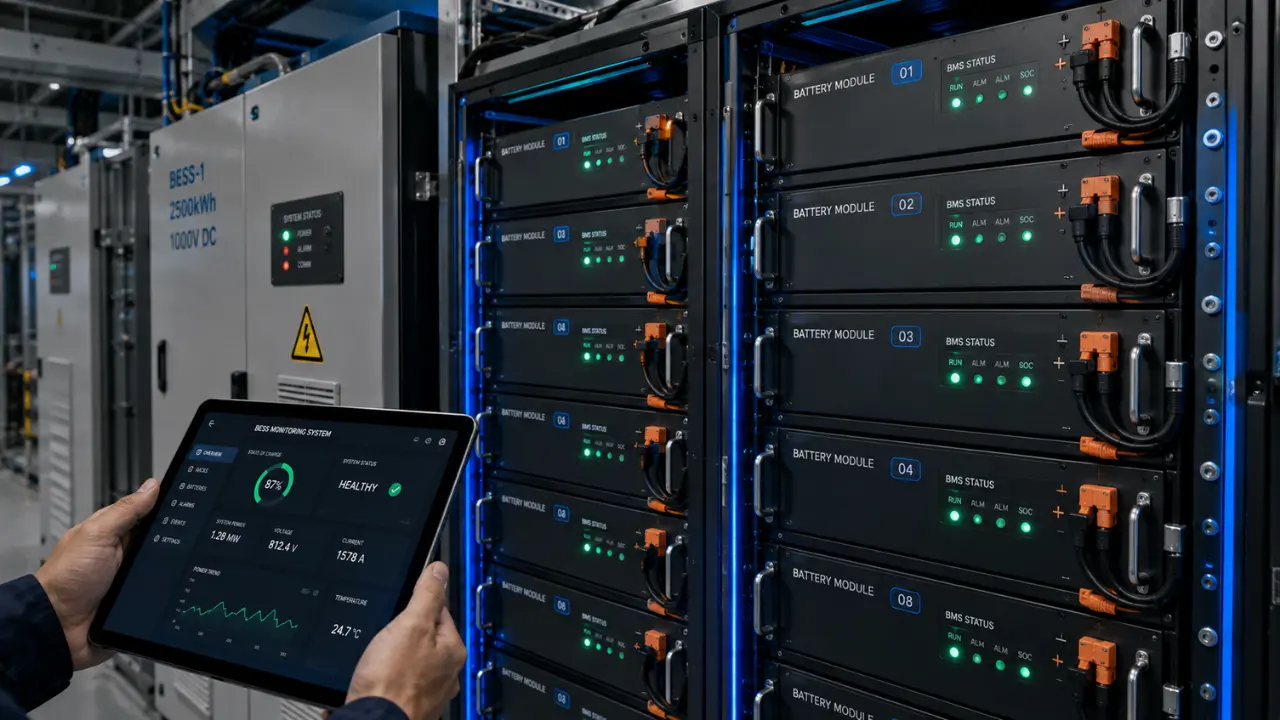
Every installation starts with individual cells, wired in series and parallel into modules, then stacked into racks to reach the target voltage and capacity. A single LFP prismatic cell runs about 3.2V nominal; stack sixteen in series and you get roughly a 51.2V module; string several modules and a rack commonly sits at 600 to 1,000+ VDC. That hierarchy matters because every joint is a place where imbalance, resistance, and heat can accumulate: a rack is only as good as its weakest module, and a module only as good as its weakest cell.
The Battery Management System: The Layer That Keeps Cells Alive
The Battery Management System (BMS) monitors cell voltage, temperature, and current at the module level, and coordinates protection and balancing at the rack and system level. It enforces the state-of-charge window, balances weaker cells against stronger neighbors, and trips protective disconnects on overcurrent, overtemperature, or communication loss. A BMS that isn't doing its job rarely fails dramatically; it shows up as accelerated capacity fade in a handful of cells or a rack that quietly underperforms its neighbors. The same logic governs Emerson lithium-ion batteries used in industrial field devices, scaled from a single instrument pack to a multi-megawatt-hour installation: chemistry only performs to spec if the management electronics do continuous, correct work.
Power Conversion System: Where DC Becomes Useful AC
The Power Conversion System (PCS), the bidirectional inverter, turns DC energy in the racks into grid-compliant AC power and turns AC back into DC to charge the racks. PCS units are rated in kW and set the hard ceiling on how fast the system can charge or discharge, regardless of how much energy sits in the racks, and they carry the protective relaying, ride-through, and grid synchronization logic that lets the system connect without becoming a hazard to it. Undersize the PCS relative to battery capacity, and a 2 MWh system behind a 500 kW inverter still tops out at 500 kW, fine for long-duration duty, a real problem if the application needs a fast power response. That's exactly why PCS class gets locked in during component sourcing, not after a container shows up with the wrong inverter inside.
Energy Management System: The Brain That Decides When to Charge and Discharge
The Energy Management System (EMS) sits above the BMS and PCS and makes the operational calls: when to charge, when to discharge, how to prioritize competing objectives like backup reserve versus peak-shaving revenue. It ingests utility tariff structures and site load data, sometimes weather forecasts on solar-paired systems, and dispatches the PCS accordingly, exposing state of charge and alarm status to the plant's SCADA. An EMS with no visibility into actual site load is flying blind, and that gap surfaces exactly when the system is needed most.
AC-Coupled vs DC-Coupled Architecture
The coupling decision, whether the battery ties into the site's AC bus through its own PCS or shares a common DC bus with a co-located solar array through a hybrid inverter, shapes the rest of the design. DC-coupled systems keep solar and storage on a shared DC bus, converting to AC only once: fewer conversion stages, lower round-trip losses in principle. AC-coupled systems keep the battery's PCS and the solar inverter as separate devices, an extra conversion stage but more flexible, since you can retrofit storage onto an existing solar installation, or a site with no solar at all, without re-architecting the DC side.
Most pure industrial storage projects with no co-located renewable generation default to AC coupling, since it decouples the battery's PCS from everything else on site, including any DC-DC conversion gear already managing power stability for critical loads. Sites that already rely on DC-DC converters to maintain power stability under fluctuating loads are managing a smaller version of the same problem.
Types of Battery Energy Storage Systems: Why LFP Chemistry Wins on the Stationary Side
When people ask about the types of battery energy storage systems, the conversation almost always starts at chemistry, since it drives everything downstream: cycle life, thermal behavior, and what fire protection requirements apply.
LFP vs NMC: Thermal Stability and Cycle Life
Lithium iron phosphate (LFP) and nickel manganese cobalt oxide (NMC) are the two chemistries that matter for stationary and industrial storage, and LFP is now the dominant choice for new installations, accounting for the large majority of new commercial and industrial battery shipments. The reasoning is physics, not marketing preference.
LFP's iron-phosphate cathode is far more thermally stable than NMC's layered oxide structure. LFP cells typically don't reach thermal runaway until somewhere in the 270°C to 300°C range, well above NMC's typical onset around 200 to 210°C, before a cell failure can propagate into a fire event, and that gap is the biggest reason fire engineers treat LFP and NMC installations differently when scoping hazard mitigation analysis under NFPA 855.
Cycle life follows the same pattern: LFP commonly delivers 6,000 to 10,000 cycles at practical depth-of-discharge, roughly two to three times what NMC delivers in comparable duty, and for an installation cycling daily for ten to fifteen years, that translates directly into longer service life before augmentation, most of what determines real lifetime cost. NMC still wins on energy density, which is why it stays the default for electric vehicles, where every kilogram and liter of pack volume counts against a weight and range budget. Stationary storage doesn't carry that constraint, so LFP's lower density is a non-issue where it matters least and a clear win where it matters most. For the mainstream industrial battery energy storage system design brief today, LFP is the default.
Thermal Management: Liquid Cooling vs Forced Air
Thermal management has become one of the more consequential decisions in battery energy storage system design over the last two years.
Forced-air cooling is simpler and cheaper to install, and has been the default on smaller commercial and industrial systems for years: fans move air across the racks, accepting a wider cell-to-cell temperature spread, commonly 5°C or more, as the cost of that simplicity. Liquid cooling circulates coolant through cold plates in direct contact with the modules, and it's becoming standard at utility scale and increasingly at larger C&I scale because it holds temperature variation much tighter, commonly within 2 to 3°C across a rack. Tighter uniformity means slower, more even degradation instead of a handful of hot cells aging out early and dragging the whole rack's usable capacity down.
The tradeoff is real: liquid cooling adds pumps, manifolds, coolant, and a leak-detection problem air cooling doesn't have, plus 10 to 20 percent to upfront cost. Forced air is still defensible for a small system on a light duty cycle; for a large system running daily deep cycles, or in a hot climate, the economics increasingly favor liquid cooling. A cooling failure, a stuck valve, a fouled cold plate, a chiller that trips off unnoticed, is a plausible path from a single cell fault to full propagation, which is why hazard mitigation analysis under NFPA 855 weighs cooling reliability alongside cell chemistry.
Battery Energy Storage System Design: Sizing Methodology
Power Rating, Energy Rating, and C-Rate
Good battery energy storage system design starts by separating two numbers that get conflated constantly: power rating in kW, how fast the system can push or absorb energy, and energy rating in kWh, how much it can hold and deliver before it's empty. Divide energy by power and you get duration in hours.
C-rate ties the two together at the cell and rack level: a 1C rate discharges fully in one hour, 0.5C means two hours, 2C means 30 minutes. Most stationary LFP racks are rated for continuous discharge in the 0.5C to 1C range, comfortably covering the one- to two-hour systems that dominate peak shaving and demand charge management. Applications needing fast power response, like frequency regulation, push toward higher C-rates and shorter durations, shifting the sizing constraint from energy capacity toward PCS power and cell current handling.
Matching Duration to Use Case
The use case sets the target duration, and getting this wrong is the most common battery energy storage system design mistake:
- Peak shaving and demand charge management typically need 30 minutes to 2 hours at the target power reduction, sized against the site's actual peak event length.
- Backup power needs duration matched to the critical load list and the realistic time to restore utility power or start a generator, commonly 15 minutes to 4 hours.
- Renewable smoothing operates on shorter timescales, seconds to minutes, damping ramp rates from cloud transients or wind gusts rather than storing bulk energy.
A power system audit that captures actual interval load data, ideally 12 months at 15-minute resolution, is the input every one of these sizing exercises depends on. Guessing at peak magnitude and duration from a monthly utility bill produces a system sized wrong in one direction or the other.
Fire Safety and Siting: NFPA 855, UL 9540A, and NEC Article 706
Fire safety isn't a bolt-on for a BESS. It's a design input from day one, and three standards govern most of the decision tree.
NFPA 855, the Standard for the Installation of Stationary Energy Storage Systems, sets installation, spacing, and fire protection requirements by chemistry, location, and system size. Its 2026 edition expanded coverage to more electrochemical storage technologies beyond lithium-ion and pushed hazard mitigation analysis and large-scale fire testing further, with new emergency response planning provisions. It determines setback distances from buildings and property lines, whether an installation needs fire detection, suppression, or explosion control, and what the response plan must cover before a facility gets a permit, scoping work that belongs under engineering services before equipment gets specified.
UL 9540 is the product safety standard for the energy storage system and its equipment as a whole. UL 9540A is the test method evaluating thermal runaway propagation, cell to module, module to unit, unit to installation, and its results often determine whether an authority having jurisdiction requires separation or suppression beyond baseline NFPA 855 requirements. NEC Article 706 covers the electrical installation side for any system above 3.6 MJ (1 kWh): disconnecting means, overcurrent protection, circuit sizing, listing, and emergency shutdown, alongside NFPA 855, not in place of it.
Chemistry choice and cooling architecture aren't separate decisions from fire safety. They're the two biggest levers that determine how expensive the NFPA 855 compliance path turns out to be.
Round-Trip Efficiency, Degradation, and Warranty
Round-trip efficiency (RTE), the ratio of energy delivered out to energy put in over a full cycle, is a real economic number, not a marketing spec: every point lost is energy the customer paid for and never got back. DC-coupled systems, with fewer conversion stages, tend to land higher, often low-to-mid 90s percent in real-world operation; AC-coupled systems more commonly land high-80s to low-90s.
Degradation comes from two overlapping mechanisms: calendar aging, driven mostly by state-of-charge and temperature exposure over time regardless of cycling, and cycle aging, driven by the number and depth of charge-discharge cycles. Most LFP systems operate within a limited state-of-charge window, commonly around 10 to 90 percent rather than the full range, trading some day-one capacity for meaningfully slower degradation over the warranty term.
Warranty structures across major manufacturers have converged on a similar shape: roughly ten-year terms guaranteeing a defined percentage of nameplate capacity retained at end of term, commonly 60 to 70 percent, sometimes paired with a cycle cap. Read the fine print on temperature limits before treating the guarantee as unconditional; a system run outside its specified envelope, exactly the failure mode an undersized cooling system produces, can void that coverage even without a hard fault.
Interconnection and Protection Relaying Basics
Any installation connecting to a site's electrical distribution, or exporting to the grid, has to satisfy interconnection requirements that protect both the site and the utility system it ties into. IEEE 1547-2018, the standard for interconnection and interoperability of distributed energy resources, sets the technical baseline: voltage and frequency ride-through, anti-islanding protection so the system can't backfeed a de-energized line, reactive power support, and the interoperability functions utilities increasingly require.
At the relaying level, the PCS carries most of this responsibility: detecting an abnormal grid condition and disconnecting within defined time windows, coordinating with the site's existing protective devices so a discharge event doesn't desensitize an upstream breaker, and reporting status back to the utility. This is the same coordination discipline that governs selecting the right UPS for industrial control systems: the storage device is only as safe as its ability to sense and respond to a fault faster than it can make the fault worse. Utility interconnection agreements add site-specific requirements, export limits, metering, sometimes disconnect switches, and get scoped early, since study timelines routinely outrun equipment lead times.
A Real-World Scenario: Sizing a BESS for Peak Shaving at an Industrial Facility
The Load Profile
A representative scenario: a textile finishing plant runs dyeing, drying, and compressor loads across two shifts. Twelve months of 15-minute interval data from the utility meter shows a steady baseline demand around 1,200 kW, with short peaks to roughly 1,500 kW when compressors, chillers, and drying ovens cycle on together near shift changeover. Those events last 45 to 70 minutes, and the utility bills demand charges against the single highest 15-minute interval in the period, so one bad 45-minute window sets the charge for the entire month.
The Sizing Math
The target: shave the metered peak from roughly 1,500 kW down to a ceiling around 1,200 kW, a 300 kW reduction. That 300 kW is the power rating requirement; adding margin for derating and future load growth lands on a PCS selection around 350 kW. Duration comes from the worst observed event length, not the average: the average event runs 45 minutes, but the worst case in a full year runs 70, so size for close to that worst case with margin, say 75 minutes, or 1.25 hours. Energy required is power times duration: 300 kW × 1.25 h = 375 kWh of deliverable energy at the point of use.
That figure isn't the nameplate battery capacity. Operating the pack within a limited state-of-charge window to protect cycle life, commonly around 80 percent of nameplate usable, and accounting for round-trip losses and expected fade over the warranty term, pushes the nameplate spec upward, typically landing around 480 to 520 kWh to reliably deliver 375 kWh at the busbar over the system's service life. Checking the C-rate, 300 kW against roughly 500 kWh nameplate works out to 0.6C, well inside the 0.5C to 1C continuous rating most stationary LFP racks carry, confirming the exercise is constrained by the facility's power and duration requirement, not the cells' current limit, exactly how a peak-shaving system should be sized.
What It Revealed
The exercise also surfaced something the plant hadn't tracked: the shift-changeover peak was largely avoidable through load sequencing, staggering compressor and oven startup by ten minutes cut the peak on its own. The system still made sense for the remaining peak and for outage ride-through on critical control and lighting loads, but sized against real interval data it came in smaller and cheaper than the plant's first estimate, which had been pulled off a single bad month's bill.
Battery Energy Storage System Design at a Glance
| Design Consideration | Typical Range / Requirement |
|---|---|
| Dominant chemistry | LFP, thermal stability plus 6,000–10,000 cycle life |
| Thermal runaway onset | LFP ~270–300°C vs NMC ~200–210°C |
| Continuous C-rate (LFP racks) | 0.5C to 1C for most peak shaving/demand charge systems |
| Round-trip efficiency | High-80s to mid-90s percent, DC-coupled trending higher |
| Cell-to-cell temperature spread | ≤3°C liquid-cooled vs 5°C+ air-cooled |
| Warranty term | ~10 years, commonly 60–70% capacity retention |
| Fire safety and equipment listing | NFPA 855 (2026 ed.), UL 9540 / UL 9540A, NEC 706 |
| Interconnection standard | IEEE 1547-2018 |
Specifying a battery energy storage system that holds up means treating power rating, energy rating, chemistry, thermal management, and fire protection as one design problem, not five separate purchase decisions made at different stages of a project. Techno Control Corp works through load data, sizing math, and component sourcing with plant teams who need a system built against actual site conditions, from audit through interconnection coordination before equipment ships. If you're evaluating a BESS for your facility, contact our team to walk through your load profile and get a design sized against real data, not a rule of thumb.
Related products
Components from our catalogue relevant to this article — request a quote for availability, lead time and pricing.
/TC625 AF100 ABB - Coaxial Modem 3BSE002224R1.png "ABB TC625 AF100 ABB - Coaxial Modem 3BSE002224R1 | Coaxial modem TC625 AF100")
TC625 AF100 ABB - Coaxial Modem 3BSE002224R1
Coaxial modem TC625 AF100
/SB512 ABB - Power Supply 3BSE002098R1.png "ABB SB512 ABB - Power Supply 3BSE002098R1 | SB512 power supply module")
SB512 ABB - Power Supply 3BSE002098R1
SB512 power supply module
/DSSS 171 ABB - Voting Unit 3BSE005003R1.png "ABB DSSS 171 ABB - Voting Unit 3BSE005003R1 | DSSS 171 voting unit for safety systems")
DSSS 171 ABB - Voting Unit 3BSE005003R1
DSSS 171 voting unit for safety systems
/4NWP100174R0001 ABB - UPS PowerValue 11LI Up 2000 VA.webp "ABB 4NWP100174R0001 ABB - UPS PowerValue 11LI Up 2000 VA | UPS PowerValue 11LI Up 2000 VA")
4NWP100174R0001 ABB - UPS PowerValue 11LI Up 2000 VA
UPS PowerValue 11LI Up 2000 VA